In the final part of this tutorial series we will make some slight adjustments to the graph, and then provide the ability to record your weight in HealthKit.
You can either jump back to the beginning where we created a line graph with Paintcode, start on step 2, or begin here by downloading the project as we left it at the end of the last tutorial.
Reducing the Range
To make the data presented on the graph more readable we need to reduce the range. In the previous Graphs.swift class created by Paintcode the bottom end was always 0 and the top end was rounded up to the next 100. The rounding up was done by getting the highest body mass for the provided data and then using ceil to round up.
What could work better here is the ability to round up to the nearest 5 and round down to the nearest 5 making the range a lot shorter and thus, allowing you to view the data far more easily.
Lets begin by opening Graphs.pcvd in PaintCode. You’ll find the Graphs.pcvd file in the root of the project you downloaded from yesterday. I added it to allow easier access for the tutorial although it wouldn’t be needed for the app to run.
Making Changes to Graphs in PaintCode
 The first step is to change the name of the “height” variable to upperValue. It is to retain the same settings as before, namely to be a number.
Next, duplicate this by using cmd+c and cmd+v. Rename that to lowerValue. I suggest lowering the value to maybe 20 below the upperValue.
Next add a bottomValue and set up as an expression with the following:
stringFromNumber(lowerValue)
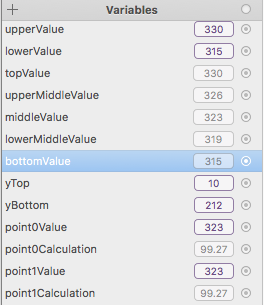
By the end of this you will have the following towards the top end of your variables. I re-ordered the ones related to the horizontal lines on the graph just to make it easier to know that middle is middle and upper middle is just above that.
Next, click on the small circle next to bottomValue and drag to the bottom value that was previously hard set to 0. Then select “Text”. This now links the bottomValue with the bottom line on the graph.
A number of changes have been made. We have renamed a variable, added new ones, and made a few other changes and because of this, the plotted points now do not match with the data. We also have upper mid, mid, and lower mid values that are showing incorrectly.
Lets first work on setting the correct values on the Y axis. The middle value needs to now have this expression:
stringFromNumber(lowerValue+((upperValue-lowerValue)/2))
I’ll briefly explain. We need to find out the difference between the upper and lower values. We then divide that by 2 to get the halfway point. If the upper was 200 and the lower was 190, the mid value would need to be 195. So 200 – 190 = 10. Divide that by 2 = 5. We then need to add that 5 to the lower value to make 195.
The upper mid and lower mid are done in a similar way, but instead of dividing by 2, we divide by 4 for the lower section (i.e., 10/4=2.5… 190+2.5=192.5). We end up with:
stringFromNumber(lowerValue+((upperValue-lowerValue)/4))
For the upper middle value we need to find 3/4 of the range, so what we do here is also divide the range by 4, but then we multiply that by 3 to get the 3/4 line. That would be 10/4=2.5 and then multiplied by 3=7.5 and add 190=197.5. This is entered as follows:
stringFromNumber(lowerValue+(((upperValue-lowerValue)/4)*3))
The numbers when converted to a string value are rounded making 192.5 in to 193 and so on.
At this point you should be able to increase and decrease the upperValue and lowerValue and see the values update as needed.
To make the final adjustments to the graph we now need to calculate where each point is plotted based on the adjusted range. The equations used in the last project are based on the bottom line being at 0, but now we have shifted the lower end to much closer to the data.
We accomplish this by using the following equation (adjusting point0Value to point1Value, point2Value and so on for each point):
yBottom – yTop + 5 – (((yBottom – yTop)/100)*(((point0Value-lowerValue)*100)/(upperValue-lowerValue)))
The equation is quite long. The quickest way I found to accomplish this was to work in percentages. The first part (yBottom – yTop + 5 – ) is used to change the calculations to work with a point of origin at the top left instead of bottom left (like the iPhone uses). Like the previous version of the project, the +5 is the offset because the top line isn’t at 0 points.
The next part calculates the range of points running down the chart. We set these manually in PaintCode as 212 for the yBottom value and 10 for the yTop value. This is where the bottom and top lines rest in points used on the canvas. We divide that by 100 to get a percentage value. In this case the answer is 2.02 which means each percent is 2.02 points. 50% for example would be marked at Y=101, or 101 points down the screen.
The latter part of the equation finds the percentage of the weight provided (between the bottom and top range).
When these 3 parts are put together it plots the point accurately on the graph.
When point0 is working, use the same equation for points1-6 making sure you change the reference to point1Value etc… as needed.
This equation can be written in different ways. You might want to simplify it a little or come up with a different calculation. Either way, feel free to use this one as I found it works well. When I simplified by removing brackets etc… I found that the result was just as complicated to write up, so decided to stick to the original one.
Exporting Graphs
We now need to export the StyleKit in PaintCode. Select the StyleKit tab, click the big blue Export button, and choose a location to save. You want to overwrite the previous version of Graphs.swift that was provided in the project from the last tutorial.
Making the Changes in Xcode to Work with the New Graph Class
When you have replaced the Graphs.swift file you’ll now be getting some errors. One of the variables changed name, and a new one was introduced. Lets fix this first.
Open up LineView.swift. You need to make adjustments so it contains the code below (note that height is no longer used and has been replaced with upperValue.
//// Set the UIColors here. Defaults are .red and .gray
    public var lineColour = UIColor .red
    public var pointColour = UIColor .red
    public var horizontalLineColour = UIColor .gray

    //// The value of the top line on the graph (defaulted to 10)
    public var upperValue : CGFloat = 10.0
    public var lowerValue : CGFloat = 0

    //// point0 is on the far left of the graph.
    public var point0 : CGFloat = 0.0
    public var point1 : CGFloat = 0.0
    public var point2 : CGFloat = 0.0
    public var point3 : CGFloat = 0.0
    public var point4 : CGFloat = 0.0
    public var point5 : CGFloat = 0.0
    public var point6 : CGFloat = 0.0

    //// Linewidth is defaulted to 2.0
    public var lineWidth : CGFloat = 2.0

    // Only override draw() if you perform custom drawing.
    // An empty implementation adversely affects performance during animation.
    override func draw(_ rect: CGRect) {
        Graphs .draw_7PointLine(frame: self.frame,
                                resizing: .aspectFit,
                                line: lineColour,
                                point: pointColour,
                                horizontal: horizontalLineColour,
                                upperValue: upperValue,
                                lowerValue: lowerValue,
                                point0Value: point0,
                                point1Value: point1,
                                point2Value: point2,
                                point3Value: point3,
                                point4Value: point4,
                                point5Value: point5,
                                point6Value: point6,
                                lineWidth: lineWidth)


    }
Errors in LineView.swift will now have been fixed. I think the changes are self explanatory, but briefly, height was replaced with upperValue, and we added in lowerValue. We also made a change to the .draw_7PointLine method and included the lowerValue and renamed height to upperValue. We also specified the correct variables to use in this method call.
Errors will still persist in ViewController now because we set the variables in here to draw the graph.
In the updateGraph method we need to change it to the following:
func updateGraph(notification: Notification) {
        print(notification.object!)
        let weightArray = notification.object as! Array

        // Find the HKQuantitySample with the largest quantity and lowest quantity.
        let maxSample = weightArray.max { a, b in a.quantity.doubleValue(for: HKUnit.init(from: .pound)) < b.quantity.doubleValue(for: HKUnit.init(from: .pound)) }
        let lowSample = weightArray.min { a, b in a.quantity.doubleValue(for: HKUnit.init(from: .pound)) < b.quantity.doubleValue(for: HKUnit.init(from: .pound)) }

        // Set the upper and lower values rounding up and down.
        lineView.upperValue = CGFloat.init(5 * ceil((maxSample?.quantity.doubleValue(for: HKUnit.init(from: .pound)))!/5))
        lineView.lowerValue = CGFloat.init(5 * floor((lowSample?.quantity.doubleValue(for: HKUnit.init(from: .pound)))!/5))

        for weightElement : HKQuantitySample in weightArray {
            if Calendar.current.isDate(weightElement.startDate, inSameDayAs: Date.init(timeIntervalSinceNow: -6*24*60*60)) {
                lineView.point0 = CGFloat.init(weightElement.quantity.doubleValue(for: HKUnit.init(from: .pound)))
            } else if Calendar.current.isDate(weightElement.startDate, inSameDayAs: Date.init(timeIntervalSinceNow: -5*24*60*60)) {
                lineView.point1 = CGFloat.init(weightElement.quantity.doubleValue(for: HKUnit.init(from: .pound)))
            } else if Calendar.current.isDate(weightElement.startDate, inSameDayAs: Date.init(timeIntervalSinceNow: -4*24*60*60)) {
                lineView.point2 = CGFloat.init(weightElement.quantity.doubleValue(for: HKUnit.init(from: .pound)))
            } else if Calendar.current.isDate(weightElement.startDate, inSameDayAs: Date.init(timeIntervalSinceNow: -3*24*60*60)) {
                lineView.point3 = CGFloat.init(weightElement.quantity.doubleValue(for: HKUnit.init(from: .pound)))
            } else if Calendar.current.isDate(weightElement.startDate, inSameDayAs: Date.init(timeIntervalSinceNow: -2*24*60*60)) {
                lineView.point4 = CGFloat.init(weightElement.quantity.doubleValue(for: HKUnit.init(from: .pound)))
            } else if Calendar.current.isDate(weightElement.startDate, inSameDayAs: Date.init(timeIntervalSinceNow: -1*24*60*60)) {
                lineView.point5 = CGFloat.init(weightElement.quantity.doubleValue(for: HKUnit.init(from: .pound)))
            } else if Calendar.current.isDate(weightElement.startDate, inSameDayAs: Date()) {
                lineView.point6 = CGFloat.init(weightElement.quantity.doubleValue(for: HKUnit.init(from: .pound)))
            }

        }

        lineView.setNeedsDisplay()
    }
On lines 6 and 7 we look for the maxSample and lowSample which means the recorded weight which is highest and the one that is lowest. We find the lowest value by using .min.
Lines 10 and 11 are where we set the upper and lower values on the graph. Instead of rounding up to the nearest 100, in this version we are rounding up to the nearest 5 and likewise, we round down to the nearest 5. This provides a tighter range and makes fluctuations more visible than they would be compared to the large range from the previous version.
Starting line 13 we iterate through the array and use some if/then control statements to determine which point is updated. We do this by comparing the startDate of the weightElement and then use the inSameDayAs: from the Calendar class to see if a provided date matches. If so, it updates the relevant point. After looping through the needed amount of times, we'll either have the default value of zero for a point, or the correct value for the day. This allows us to easily skip over empty days. It also has the benefit of not causing a problem when a day contains 2 values. In these cases the point will be set again when the same date and new value are passed through. You might want to consider adding some logic in here that detects if one value is of no use such as too far out and can be safely ignored. If using this code in production, make sure you handle the case for days with no data. Right now, all days that have no data recorded are just defaulted to zero. You will probably handle this in a way that works best for you and your users.
How to Share Data in HealthKit
 The next step is to prepare the app for being able to share (write) data to HealthKit. This will require a couple of changes to the view, and then a few tweaks to HealthManager.swift.
Lets begin by opening main storyboard. In the example today, we'll just look at writing todays data. If you want to allow entering data from any date in the past, you might consider a UIPickerView to select a date to pass. You only need 1 date as you can use the same date for both the start and end for each entry.
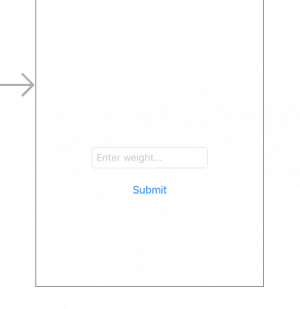
To get this working, I added a UITextField and a UIButton just below the UIView we added previously.
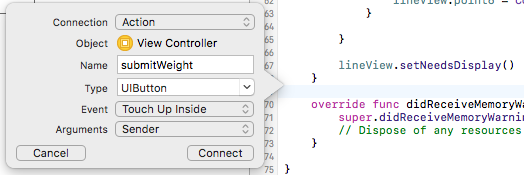
Next, I connected them up to the view controller (ctrl+drag). The UITextField was added as an IBOutlet while the submit button was added as an IBAction.


Now move to HealthManager.swift. Here we'll create a public function that we can call from the main view when we tap the submit button.
public func submitWeight(weight: Double, forDate : Date) {
        let quantityType = HKObjectType.quantityType(forIdentifier: HKQuantityTypeIdentifier.bodyMass)!
        let bodyMass = HKQuantitySample (type: quantityType,
                                         quantity: HKQuantity.init(unit: HKUnit.pound(), doubleValue: weight),
                                         start: forDate,
                                         end: forDate)
        healthStore.save(bodyMass) { success, error in
            if (error != nil) {
                print("Error: \(String(describing: error))")
            }
            if success {
                print("Saved: \(success)")
            }
        }
    }
In the above code, we declare a public function called submitWeight which accepts a Double value and a Date.
Line 2 we create the quantityType which is a bodyMass.
We use the quantityType on the next line where we create a quantity sample. Here we pass in the type, quantity (specifying the weight that was passed in to the function), and specify the start and end date which are the same as each other.
On the next lines we save the bodyMass and use a closure which has a success (a BOOL) and an error. In this app we'll just print this to the console, but you would probably want to warn your user if there was ever an error. Errors might include access being denied to HealthKit, or perhaps the lack of HealthKit on the device.
Moving back to ViewController.swift, add the following:
@IBAction func submitWeight(_ sender: UIButton) {
        let healthManager = HealthManager()
        let weight = (weightTextField.text! as NSString).doubleValue
        healthManager.submitWeight(weight: weight, forDate: Date())
    }
Here we create a HealthManager object. On the second line we want to get the double value from the string of the UITextField .text property. Unfortunately there isn't a direct way for a String object like there is an NSString, so what we do is access the .doubleValue on the text property as an NSString.
On the next line we call the submitWeight method and pass in the weight and date.
One thing to note is that using a textfield this way is quite clumsy. We are assuming a lot here, particularly that the user will enter a value that can be easily converted to a double value and that there will be no errors. As always, check for errors here. You might opt to use the delegate of the UITextField and when an invalid character is entered, you could ignore and delete it.
The next and final step is to add a Refresh button to the view in the storyboard. Wire this up by CTRL+dragging from the refresh button to the ViewController.swift class and create an IBAction. We will add the following:
@IBAction func refreshGraph(_ sender: UIButton) {
        let healthManager = HealthManager()
        healthManager.fetchWeightData()
    }
All we do here is create a HealthManager object, and call fetchWeightData. To call that method you just need to add the word "public" before the declaration in the HealthManager class.
Go ahead and run the app. If you enter a value, hit submit to save it, then hit refresh and the graph will update and adjust to the new values you specified.
You can download the final project here.
Leave a Reply
You must be logged in to post a comment.